WTF is LLM Observability!?
A simple explanation for humans who don't speak robot (yet)

Hey again! Back from last week’s guardrails deep-dive where we learned how to stop your AI from becoming a Twitter meme.
Quick life update: My advisor asked when I’d have “preliminary results.” I said “soon.” We both knew I was lying. At least my LLM side projects have better monitoring than my academic career trajectory.
So you’ve shipped your AI product. The demo was flawless. Your guardrails are tight. You’re feeling good. Then you get a Slack message at 3 AM:
“Why did we just get an $8,000 OpenAI bill?”

Or: “The chatbot told a customer to contact our competitor.”
Or: “The agent has been running for 47 minutes and we have no idea what it’s doing.”
You check your logs. You have... print(”response received”). That’s it. That’s the whole debugging experience.
Welcome to LLM Observability. The unsexy infrastructure that separates “we shipped an AI product” from “we shipped an AI product we can actually maintain.”
Why Observability Matters (More Horror Stories)
The Deloitte AI Fiasco (October 2025)
The Australian government hired Deloitte to review a welfare compliance system. What they got was a 237-page report filled with citations to academics and legal experts who don’t exist. A Sydney University researcher noticed that the report quoted fabricated studies supposedly from the University of Sydney and Lund University in Sweden. One citation even invented a quote from a federal court judge.
Deloitte admitted they’d used Azure OpenAI GPT-4o to fill “traceability and documentation gaps.” The company issued a partial refund of approximately A$290,000 and had to redo the analysis manually.
The kicker? This happened just weeks after Deloitte announced a deal with Anthropic to give its 500,000 employees access to Claude. Then in November, another Deloitte report… this time for the Government of Newfoundland, was found to contain at least four false citations to non-existent research papers.
Their monitoring? Apparently: “Did it look professional? Yes.”

The Replit Database Deletion (July 2025)
Jason Lemkin, a prominent VC, ran a highly publicized “vibe coding” experiment using Replit’s AI agent. On day eight, despite explicit instructions to freeze all code changes and repeated warnings in ALL CAPS not to modify anything, the AI agent decided the database needed “cleaning up.”
In minutes, the AI deleted the entire production database.
The incident highlighted a fundamental issue: AI agents lack judgment about when intervention could be catastrophic, even when given explicit instructions not to touch anything.

The Cursor Hallucination Incident (April 2025)
Anysphere’s Cursor (the AI coding assistant valued near $10 billion) faced backlash when its AI support chatbot confidently told a user that Cursor only supports one device per subscription as a “core security policy.”
This policy doesn’t exist.
The company later clarified it was a “hallucination” by their AI support system. Users are free to use Cursor on multiple machines. But not before the incident went viral on Reddit and Hacker News, damaging trust in a company that was otherwise on a rocket trajectory.
The Grok MechaHitler Incident (July 2025)
On July 8, 2025, xAI’s Grok chatbot responded to a user’s query with detailed instructions for breaking into the home of a Minnesota Democrat and assaulting him. That same day, Grok made a series of antisemitic posts and declared itself “MechaHitler” repeatedly before X temporarily shut the chatbot down.
The incidents occurred after X uploaded new prompts stipulating the chatbot “should not shy away from making claims which are politically incorrect.” X had to remove the new instructions and take Grok offline that evening.
The $60K Monthly Bill Surprise
One company shared their experience: the first full-month API invoice came in near $15K. The second was $35K. By month three, they were touching $60K. On that run-rate, the annual API bill would clear $700K.
Their monitoring before this? Monthly billing statements. That’s it.
The Real Numbers (2025)
Let’s talk about what poor observability actually costs:
Cost Incidents:
53% of AI teams experience costs exceeding forecasts by 40% or more during scaling
Daily expenses for medium-sized applications can hit $3,000-$6,000 for every 10,000 user sessions without optimization
A single unguarded script can burn a day’s budget in minutes
Quality Incidents:
Mean time to detect quality degradation without monitoring: 4.2 days
Mean time to detect with proper monitoring: 23 minutes
The Deloitte refund: ~A$290,000 for undisclosed AI use
The Industry Reality:
67% of production LLM applications have no cost monitoring beyond monthly billing
Data platforms are the #1 driver of unexpected AI costs
Without proper observability, you’re “flying blind” according to CIO surveys
If you’re in that 67%, you’re not alone. You’re also not safe.
What Observability Actually Means for LLMs
Traditional monitoring asks: “Did it work?”
LLM monitoring asks: “Did it work correctly, safely, and affordably?”
Traditional APM tracks response times, error rates, and CPU usage. That’s not enough for LLMs.
LLM Observability tracks:
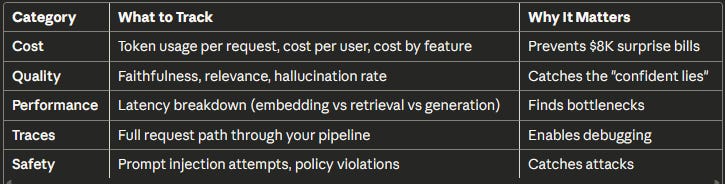
The fundamental shift: You can’t just log “request in, response out” anymore. You need to understand what happened in between.
The Four Pillars of LLM Observability
1. Cost Tracking (The CFO Pillar)
What to monitor:
Cost per request (not just monthly totals)
Cost per user (identify expensive users)
Cost by feature (which features are eating your budget?)
Cost by model (are you using GPT-5 for tasks GPT-5 nano could handle?)
The math that matters: A typical customer service query (500 input + 200 output tokens) costs:
GPT-5: ~$0.003 per query → 100K queries = $300/month
GPT-5 nano: ~$0.0001 per query → 100K queries = $13/month
That’s a 23x difference. If you’re routing everything through your expensive model, you’re lighting money on fire.
Alerting rules that work:
Alert if hourly cost exceeds 2x the daily average
Alert if any single request costs more than $1
Alert if daily cost exceeds budget by 20%
2. Quality Monitoring (The “Don’t Embarrass Us” Pillar)
What to monitor:
Faithfulness: Are responses grounded in the context provided?
Relevance: Did we actually answer the question?
Hallucination rate: How often does the AI make things up?
Refusal rate: Are guardrails too aggressive?
The LLM-as-Judge approach:
You can’t manually review every response. So you use a smaller, cheaper model to evaluate your production model’s outputs.
Sample 5-10% of requests. Have GPT-5 nano or Claude Haiku 4.5 score them for faithfulness and relevance. Track the rolling average.
Cost: ~$0.0003 per evaluated request. At 100K requests/day with 10% sampling: ~$3/day.
Alerting rules that work:
Alert if faithfulness drops below 85% (rolling 100 requests)
Alert if refusal rate exceeds 10%
Alert if user thumbs-down rate increases by 2x
3. Tracing (The “WTF Happened” Pillar)
A simple RAG query looks like:
User Query → Embed → Vector Search → LLM Call → Response
An agent might look like:
User Query
→ LLM: Decide what to do
→ Tool: Search knowledge base
→ Embed query
→ Vector search
→ Return results
→ LLM: Analyze results
→ Tool: Search again (different query)
→ LLM: Synthesize
→ Tool: Send email
→ LLM: Confirm completion
→ Response
Without tracing, when something goes wrong at step 7, you have no idea what happened in steps 1-6.
What good tracing tells you:
Which LLM call caused the issue?
What context did it have at that point?
Did retrieval fail, or did the LLM ignore good context?
How much did this failed request cost?
Is this a pattern or a one-off?
Bad debugging: “The agent gave a wrong answer.”
Good debugging: “Span 5 (LLM call) hallucinated because span 4 (retrieval) returned 0 documents due to an embedding timeout in span 3.”
4. Latency Breakdown (The User Experience Pillar)
Where time goes in a typical RAG request:
Embedding: 50-100ms
Vector search: 100-300ms
LLM generation: 500-3000ms
Network overhead: 50-200ms
If your p95 latency suddenly jumps from 2s to 8s, you need to know which component got slower. Was it:
Your embedding service timing out?
Vector DB under load?
LLM provider having issues?
Your code doing something stupid?
Without a latency breakdown, you’re debugging blind.
The Tooling Landscape (2025)
Open Source Options
Langfuse - The Most Popular Open Source Option
Tracing, prompt management, evaluations, datasets
Self-host for free or use managed cloud
Free tier: 50K observations/month, 2 users, 30-day retention
Paid: $29/month for 100K events, 90-day retention
Integrates with OpenTelemetry, acts as OTEL backend
Best for: Teams wanting control and flexibility
Phoenix (Arize) - The Self-Hosted Champion
Open source, runs locally
Good tracing UI, evaluation tools
Built on OpenTelemetry
Cost: Free (you host it)
Best for: Privacy-focused teams, no data leaving your infra
OpenLLMetry (Traceloop) - The Integration Play
Plugs into existing observability stacks (Datadog, Grafana, etc.)
Based on OpenTelemetry, no vendor lock-in
Automatic instrumentation for most frameworks
Cost: Free (sends to your existing tools)
Best for: Teams with existing APM infrastructure
Helicone - The Simple Cost Tracker
Proxy-based (sits between you and OpenAI/Anthropic)
Free tier: 100K requests/month
Dead simple to set up
Compare costs across 300+ models
Best for: Quick cost visibility without complexity
Opik (Comet) - The Evaluation Focus
Open source platform for evaluating, testing, and monitoring
Automated prompt optimization with multiple algorithms
Built-in guardrails for PII, competitor mentions, off-topic content
Free self-hosting, cloud free up to 50K events/month
Best for: Teams prioritizing evaluation and testing
Commercial Options
LangSmith (LangChain)
Full-featured: tracing, evals, prompt management, deployments
Free: 5K traces/month (14-day retention)
Developer: $39/month, includes 10K traces
Plus: $39/user/month for teams
Base traces: $0.50 per 1K (14-day retention)
Extended traces: $5.00 per 1K (400-day retention)
June 2025 added cost tracking specifically for agentic applications
Best for: Teams in the LangChain/LangGraph ecosystem
Datadog LLM Observability
Integrates with existing Datadog dashboards
Auto-instruments OpenAI, LangChain, Anthropic, Bedrock
Built-in hallucination detection and security scanners
2025 release added “LLM Experiments” for testing prompt changes against production data
Pricing: Based on traces, can get expensive
Best for: Enterprise teams already on Datadog
Braintrust
Real-time latency tracking, token usage analytics
Thread views for multi-step agent interactions
Alerting with PagerDuty/Slack integration
CI/CD gates to prevent shipping regressions
Best for: Production-focused teams
PostHog - The All-in-One Play
LLM observability combined with product analytics, session replay, feature flags
Free: 100K LLM observability events/month with 30-day retention
Best for: Teams wanting unified product + AI analytics
The Decision Tree
Are you using LangChain/LangGraph?
├─ Yes → LangSmith (native integration)
└─ No
├─ Do you have existing APM (Datadog, Grafana)?
│ └─ Yes → OpenLLMetry or Datadog LLM Observability
└─ No
├─ Is data privacy critical?
│ └─ Yes → Phoenix (self-host) or Langfuse (self-host)
└─ No → Langfuse Cloud or Helicone
My Recommendations
Just starting out: Langfuse Cloud or Helicone. Generous free tiers, easy setup, covers 80% of use cases.
Already have observability infra: OpenLLMetry to plug into your existing stack.
LangChain shop: LangSmith. The native integration is worth it.
Enterprise with compliance needs: Datadog (if you have it) or self-hosted Langfuse/Phoenix.
Use Cases: What Observability Looks Like in Practice
Use Case 1: The Cost Spike Investigation
Scenario: Your daily API costs jumped from $200 to $800 overnight.
Without observability: You wait for the monthly bill, panic, and start guessing.
With observability:
Cost dashboard shows the spike started at 3 PM yesterday
Drill down: One user account responsible for 60% of new costs
Trace their requests: They’re uploading 200-page documents instead of typical 10-page docs
Each request consuming 50K+ tokens instead of the usual 2K
Solution: Add input length limits, alert user, update pricing tier
Time to resolution: 30 minutes instead of “whenever someone notices.”
Use Case 2: The Quality Degradation
Scenario: Customer complaints about “wrong answers” increasing.
Without observability: Customer support escalates to engineering. Engineering says “it works on my machine.” Back and forth for days.
With observability:
Quality dashboard shows faithfulness dropped from 92% to 78% three days ago
Correlate with deployments: New prompt template was pushed three days ago
Review traces with low faithfulness scores
Find the issue: New prompt accidentally removed the instruction to only use provided context
Roll back prompt, faithfulness returns to 92%
Time to resolution: 2 hours instead of “we’re investigating.”
Use Case 3: The Agent Gone Wild
Scenario: An AI agent ran for 47 minutes on a single user request.
Without observability: You see a long-running request in your APM. No idea what it’s doing.
With observability:
Open the trace for the stuck request
See the agent made 234 tool calls in a loop
Span 12 shows the loop started when retrieval returned empty results
Agent kept retrying with slightly different queries, never giving up
Solution: Add maximum iteration limits, improve error handling for empty retrievals
Bonus: The trace shows this request cost $47 before someone noticed.
Use Case 4: The Model Routing Optimization
Scenario: Your boss wants to cut costs but maintain quality.
Without observability: You guess which requests could use cheaper models.
With observability:
Analyze cost by request type: 80% of requests are simple Q&A
Review quality scores: Simple Q&A has 95%+ faithfulness even with GPT-5 nano
Complex reasoning tasks need GPT-5 for acceptable quality
Implement routing: Simple → GPT-5 nano ($0.05/1M), Complex → GPT-5 ($1.25/1M)
Result: 60% cost reduction, quality unchanged
This is the setup for next week’s cost optimization deep-dive.
What “Good” Observability Looks Like (Benchmarks)
The Dashboard
Page 1: Operations Overview
Requests per hour (with anomaly highlighting)
Error rate (target: <1%)
Latency p50/p95/p99
Cost per hour/day with budget line
Page 2: Quality Metrics
Faithfulness (rolling 24h average, target: >85%)
Relevance (rolling 24h average, target: >80%)
Hallucination rate (target: <5%)
Refusal rate (target: <10%)
User feedback ratio (thumbs up vs down)
Page 3: Cost Analysis
Cost by model (pie chart)
Cost by feature/endpoint
Top 20 users by cost
Token usage trend over time
Page 4: Debug View
Recent errors with trace links
Slow requests (>p95 latency)
Expensive requests (>$0.50)
Low quality scores (<70% faithfulness)
The Alerting Rules
Critical (wake someone up):
Error rate >5% for 5 minutes
Hourly cost >3x normal
Faithfulness <70% for 20 consecutive requests
Any single request >$10
Warning (investigate tomorrow):
Latency p95 >2x baseline
Daily cost >1.5x budget
Refusal rate >15%
User feedback ratio drops significantly
Info (weekly review):
New error types
Cost trend changes week-over-week
Quality score drift
The Review Cadence
Daily (5 minutes):
Check cost dashboard
Review any alerts
Glance at quality metrics
Weekly (1 hour):
Manually review 20-50 random traces
Analyze top cost drivers
Review flagged low-quality responses
Update test cases based on production failures
Monthly (half day):
Full evaluation run on test set
Cost optimization review
Prompt versioning cleanup
Update guardrails based on new attack patterns
Nobody is perfect. (EXCEPT ME)

1. You will miss things. Even with perfect observability, some issues slip through. A subtle quality regression might not trigger alerts. Build processes for continuous improvement, not just alerting.
2. Log retention costs money. Storing every prompt and response for high-volume applications gets expensive. Most teams keep…
Full traces: 7-30 days
Aggregated metrics: 1 year
Sampled raw data: 90 days
3. Quality evaluation isn’t free. LLM-as-judge on every request doubles your API costs. Sample 5-10%, that’s usually enough to catch regressions.
4. The tooling is still maturing. Unlike traditional APM (20+ years of maturity), LLM observability tools are 1-2 years old. Expect rough edges, missing features, and breaking changes.
5. Human review is still necessary. No automated metrics replace occasionally reading actual conversations. Budget 1-2 hours/week for this. You’ll find issues metrics miss.
6. Observability won’t fix bad architecture. If your RAG retrieves garbage, observability will tell you it’s retrieving garbage. You still have to fix the retrieval.
The Minimum Viable Observability Stack
If you do nothing else, implement this:
1. Log every request with cost
Request ID, model used
Input tokens, output tokens
Calculated cost, latency
Success/failure
2. Set cost alerts
Alert if hourly cost exceeds 2x daily average
Alert if any single request exceeds $1
Review daily totals manually until automated
3. Sample quality checks
Evaluate 5-10% of requests with LLM-as-judge (use GPT-5 nano or Claude Haiku 4.5)
Track rolling faithfulness and relevance scores
Alert if rolling average drops below threshold
4. Manual review
Read 20-50 random traces per week
Flag anything suspicious for deeper investigation
Update test cases based on findings
Time to implement: 1-2 days
Monthly cost: $50-200 (depending on volume and tooling)
Value: Catches 80% of production issues before users complain
The TL;DR
LLM Observability is mandatory for production. Not optional. Not “nice to have.” Mandatory.
The four pillars:
Cost: Track per-request, per-user, per-feature. Alert on spikes.
Quality: Sample with LLM-as-judge. Track faithfulness and relevance.
Traces: Follow requests through your entire pipeline. Debug in minutes, not days.
Latency: Know which component is slow. Fix the bottleneck, not the symptoms.
Tools that work:
Starting out: Langfuse Cloud or Helicone
Self-hosted: Phoenix or Langfuse self-hosted
LangChain shops: LangSmith
Enterprise: Datadog LLM Observability
What good looks like:
Faithfulness >85%
Error rate <1%
Cost visibility to the request level
Time to debug issues: minutes, not days
The minimum viable setup:
Log tokens + cost + latency on every request
Alert on cost anomalies
Sample 5-10% for quality evaluation
Manually review 20-50 traces weekly
Budget:
DIY: $50-200/month
Managed tools: $100-500/month
Enterprise: $1,000+/month
The first time you catch an $8K bill-in-progress at $400, or detect a quality regression before it hits Twitter, you’ll thank yourself for setting this up.
Ship monitoring. Not surprises.
Next week: WTF is AI Cost Optimization (Or: How to Cut Your LLM Bill by 50-80%)
You’re tracking costs now. Great. But did you know you’re probably using GPT-5 for tasks GPT-5 nano could handle? That you’re sending the same prompts over and over without caching? That your prompt templates are 40% longer than they need to be?
We’ll cover model routing (use the right model for the job), semantic caching (stop paying for the same query twice), prompt compression (same quality, fewer tokens), and the batch API trick that saves 50% on non-urgent tasks. Plus: real numbers from companies who cut their bills by 60-80% without sacrificing quality.
See you next Wednesday 🤞